Additional services in your Kubernetes environment
We list in this document all services that you can edit and modify yourself using the login data you received from us to connect to your Kubernetes environment. We do ask that you report your changes to these services to us, as they are all included in our automated deployment tools. And it would be unfortunate that your changes would be overwritten during the upgrades we make to these services.
Nginx Ingress
Nginx Ingress connects http(s) traffic from outside to your services and pods.
The SRE team manages the Nginx Ingress controller and all related resources in the Nginx Ingress namespace. It's best not to make any changes there; our automation will overwrite them back over time.
By defining an ingress resource in your own namespace (in addition to your pods and services), you can instruct Nginx Ingress to forward http(s) traffic for a particular domain to your pod. The example below forwards traffic for "example.com" to a service named "example-service" on port 3000.
apiVersion: networking.k8s.io/v1
kind: Ingress
metadata:
  name: example-ingress
  namespace: jouw-namespace
  annotations:
    kubernetes.io/tls-acme: "true"
spec:
  ingressClassName: nginx
  rules:
  - host: example.com
    http:
      paths:
        - path: /
          pathType: Prefix
          backend:
            service:
              name: example-service
              port:
                number: 3000
  tls:
  - hosts:
      - example.com
    secretName: ingress-tls
The annotation "kubernetes.io/tls-acme" indicates that you wish to use a free Let's Encrypt certificate for the hostnames listed under "tls" at the bottom of the yaml. In this case, the certificates are automatically put in the specified secret "ingress-tls". If you do not set the tls-acme annotation, you have to do it manually. This is the case when you use certificates from another CA. Additional information:
Cert-Manager
Cert-Manager is responsible for requesting Let's Encrypt certificates.
You rarely address this service directly. Via an annotation in your ingress resource, you indicate whether you wish to use Let's Encrypt certificates.
See also the example ingress resource on the previous page. The settings of cert-Manager itself are managed by the SRE team, it is best not to make any changes there.
When it fails to request a Let's Encrypt certificate, the cause is usually outside Cert-Manager:
- Do all A and AAAA DNS records for the domain name point to the k8s cluster?
- If you have put multiple hostnames under "tls" in your ingress resource, they should all point to the cluster. Cert-Manager requests 1 certificate with all hostnames as Subject Alternative Name, if 1 is not configured correctly none will work.
- Is there a CAA DNS record that prohibits the use of Let's Encrypt?
To get more information about a certificate request, you can check some resources via kubectl. To start with, an ingress with tls-acme annotation creates a "certificate request". This will in turn create an "order", which then creates a "challenge". If you list these resources in your namespace, you can usually see what the problem is via kubectl describe.
Can't find the problem? Feel free to ask us for help!
Additional information:
EFK (Elasticsearch - Fluentbit - Kibana)
The EFK stack is a combination of software that provides insight into the logs of the Kubernetes cluster. Of all the pods you launch, the output on stdout and stderr are also collected. So to keep track of those logs, it is enough to have your application log to stdout. Logs that get to another location (e.g. a log file on disk) will not appear in the EFK stack.
The collected logs are kept in Elasticsearch. By default, we delete logs older than 7 days every night. If desired, we can keep logs longer. However, keep in mind that both memory and disk consumption of Elasticsearch increase as more logs are kept in it. If we need to grow the volume of Elasticsearch beyond the contractually permitted usage, there will be an additional cost.
You can visualise the logs via Kibana. It is also possible to create application-specific dashboards as required. That way, you can easily gain insight into what your application (and Kubernetes) is doing at any time.
You can get the URL of the Kibana dasbhoard by retrieving the ingress:
kubectl -n efk get ingress
Fluentbit-Filebrowser
Given the memory and disk consumption of Elasticsearch, you can also opt for a simpler alternative. In this case, we replace Elasticsearch (and the Kibana dashboards) with a directory of log files. More difficult to search, but a lot cheaper in consumption. If you don't often have the need to search your logs, you can save on your cluster's precious resources this way.
We then also provide a filebrowser pod that gives you a WebUI to read and/or download the logfiles that you want to consult.
All of this is setup in the k8s-logging namespace.
The password for logging into the filebrowser WebUI can be retrieved via the kubernetes-dashboard or via kubectl -n k8s-logging get secret sre-filebrowser-password -o 'jsonparth={.data.password}'|base64 -d.
The username for logging into the filebrowser WebUI is always set to the name 'logs'.
When we enable this fluentbit-filebrowser setup, you can no longer use our EFK stack, as these are mutually exclusive with each other.
Headlamp
If you prefer managing your cluster using a GUI, you can make use of Headlamp. Headlamp is an easy-to-use and extensible Kubernetes UI. This application makes many (but not all) CLI features available via a GUI.
There are two ways you can use Headlamp: local installation or cluster installation.
Local
This application can be installed on your local computer, which helps save your cluster’s precious resources. You can find the latest release on the project website.
Headlamp will automatically add the Kubernetes clusters defined in your config (~/.kube/config).
You also have the option to add the cluster manually, by first downloading the kubeconfig from Sock.
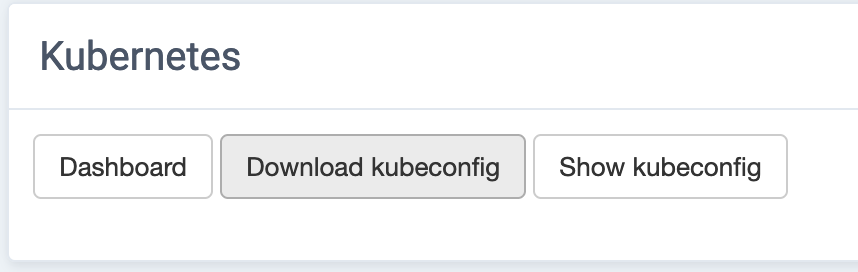
Navigate to the “Virtual servers” page in the left menu to access one of the nodes in your cluster.
Here, you will find a section with the option to download or display the complete kubeconfig file.
In Headlamp, you can add a cluster by selecting “Add Cluster” in the bottom-left corner and uploading the kubeconfig.
Cluster
Headlamp can also be installed in the cluster and is available via a web browser.
You can obtain the URL of the dashboard via kubectl -n headlamp get ingress.
To log in, you need to obtain a token. This token can be created via:
kubectl create token headlamp -n headlamp
For security reasons, this token is valid for 2 hours.
Prometheus graphs
Due to a current limitation in Headlamp, the Prometheus server URL cannot be set globally. Plugin settings are stored in the browser cache, which means each user must configure the URL individually.
To configure the Prometheus integration:
- Click on settings in the top right corner
- Select "Plugins" from the left menu, then choose "prometheus"
- Disable "Auto detect"
- Enter
victoriametrics/vmsingle-victoria:8429in the "Prometheus Service Address" field - Save your changes
Once configured, metrics will be available when viewing pod details.
Harbor
Harbor is a Docker registry with additional features. It supports versioning of your Docker images, so you can quickly roll one back to an earlier version of your container image. CVE scanning of your Docker images is also possible. In addition, it also includes full support for Helm charts, and so can also serve as a Helm repository.
You obtain Harbor's URL via kubectl -n harbor get ingress.
On the login screen, you can log in as user admin with the password obtained via:
echo $(kubectl -n harbor get secret harbor-core -o 'jsonpath={.data.HARBOR_ADMIN_PASSWORD}' |base64 --decode)
A point of interest in Harbor is the disk consumption of the images you upload. Per project you can set how many images Harbor should keep, the rest is cleaned up every night by the garbage collector. If you don't set this, the disk will fill up quickly, causing errors during deploys.
VictoriaMetrics
VictoriaMetrics (an alternative to Prometheus) collects statistics about Kubernetes and your pods. It consists of several components in the namespace "VictoriaMetrics", some of which are interesting to look at.
- Via Grafana, you get a graphical view of the collected metrics. You can also create your own dashboards here as you wish, showing relevant metrics of a particular service. This can be particularly interesting when you send additional data to VictoriaMetrics yourself.
- Alertmanager sends alerts by e-mail or to a Slack channel. It is also possible to silenced alerts, after which they do not appear for a certain period of time. This can be useful if a certain (test) service is temporarily not working.
The necessary URLs can be obtained via kubectl -n victoriametrics get ingress.
On Grafana, you can log in with username "admin" and the password obtained via:
echo $(kubectl -n victoriametrics get secret victoria-metrics-stack-grafana -o 'jsonpath={.data.admin-password}'|base64 -d)
Access the Grafana dashboards
Accessing the Grafana dashboards instance hosted on your Kubernetes cluster, but what is the URL, and how about the login credentials?
- Get the URL using
kubectl, to access the Grafana web service.for domain in $(kubectl get ingress --all-namespaces -l app.kubernetes.io/name=grafana -o jsonpath={'.items[*].spec.rules[*].host'}); do echo $domain; done - Get the login credentials for the Grafana service.
kubectl get secret --all-namespaces -l app.kubernetes.io/name=grafana -o jsonpath={'.items[*].data'} \ | jq -S '{user: ."admin-user"|@base64d, password: ."admin-password"|@base64d}' - Use your preferred webbrowser to access the Grafana dashboards, using the login credentials fetched earlier.
Note
@base64d might give an error if you are using a jq version < 1.6
You can still fetch the values, but you must use the command base64 --decode instead (not in the jq command string).
MinIO operator (optional)
MinIO is an open source implementation of an S3 service.
The MinIO operator we optionally install in the k8s cluster allows you to create your own MinIO services.
Although we take on the installation of MinIO operator, we do not configure the MinIO services.